
Analytics
Analytics turns your sessions into a readable picture: how much you focused, how often you showed up, which days were strongest, and where your study rhythm is improving.
Analytics
This page helps you understand what your study sessions add up to over time. Instead of just seeing isolated timers, you get totals, trends, streaks, and standout days in one place.
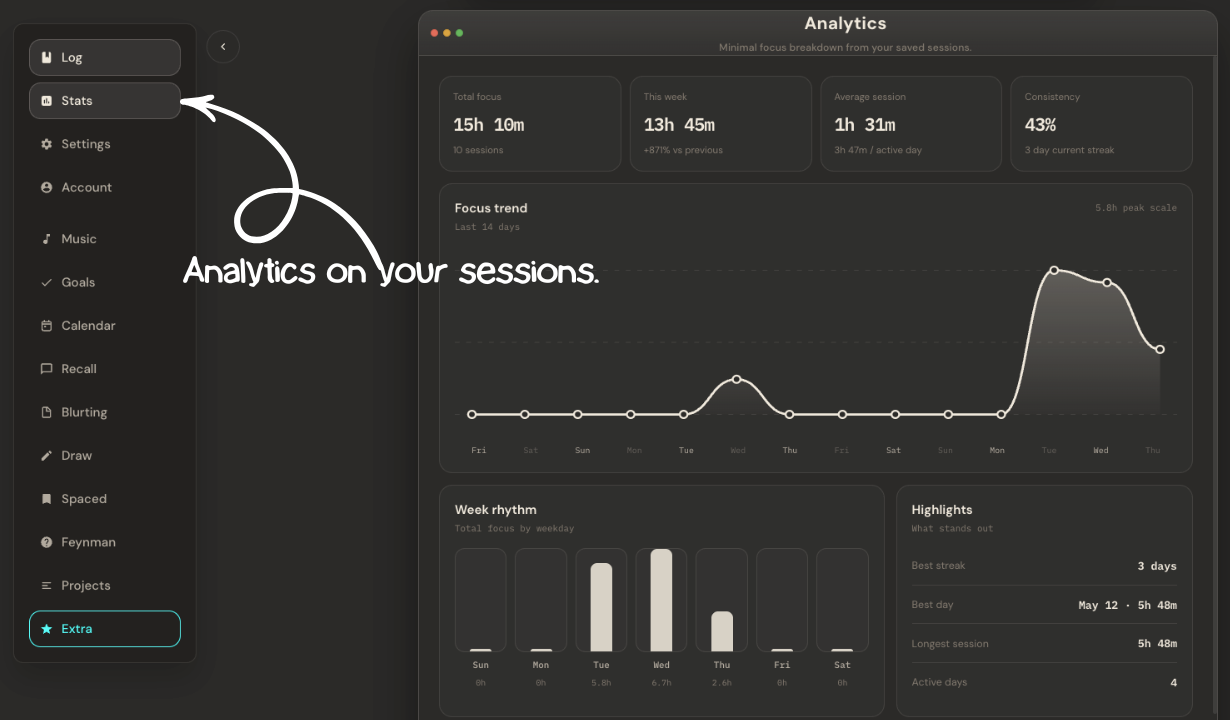
This is the total amount of focused study time recorded in the current view. It gives you the clearest top-level answer to how much real study happened.
This compares your current week against the previous one. In the sample, your study time doubled, which makes improvement easy to see at a glance.
Average session length shows how long a typical study block lasts, while active-day time shows how much focus you tend to build on the days you actually study.
Consistency tracks how regularly you return to studying. The current streak makes momentum visible, so you can protect a habit before it breaks.
The focus trend shows how your study time rises and falls across recent days. It helps you notice surges, slow periods, and whether your routine is stabilizing.
This breaks your time down by day of the week. In the sample, Tuesday and Wednesday carry nearly all the study volume, which reveals where your strongest weekly rhythm already exists.
Highlights pull out the most notable moments in your data: a 3 day best streak, a best day on May 12 with 5h 48m, a longest session of 5h 48m, and 3 total active days.
This section points to the days where your study performance was best. It helps you spot when your environment, schedule, or energy level aligned well enough to produce deep focus.